May 27, 2017: Oklahoma


Results

Storms formed along the old outflow boundary in northern Oklahoma around 3PM CDT.  We were just west of Tulsa when one developed just west of us.  It had some structure, with a couple of bands being entrained into the updraft, and produced some wonderful cloud to ground lightning.


About an hour later a stout updraft developed east of Ponca City.  It moved away from the boundary and then appeared to “ingest it” pulling it northward.  The storm had a good look with a hook echo and a weak couplet.


The picture of the anvil is courtesy Vickie Doswell.  The storm began to draw chasers away from the storm that was further east in the northern part of the Tornado Watch area (red box).


We followed this storm for about an hour until it became clearlyoutflow dominant.  As we drifted towards our overnight in Tulsa, a new storm formed and produced a tornado well southwest of us.  It was not possible for us to intercept that storm by sunset.  As we got to Tulsa, yet another storm developed southwest of Tulsa and moved over the city.  As we were eating dinner the weak mesocyclone associated with that storm passed directly over us, putting our location in the “notch”. The storm was weakening and shortly was not a supercell.


Target


We have decided on northern target. Clumping cumulus west of Oklahoma City suggests initiation is about to occur. SOuthwesterly winds aloft will be associated with initial northeast motion into that target.


Discussion

We are currently in Norman Oklahoma in a wait and see mode.  The buoyancy in this area is extreme, with 6000 J/kg forecast for the whole central and eastern part of the state this afternoon.   The morning map shows an outflow boundary on the northern border and a dryline advancing in the TX Panhandle.  There are no obvious convection initiating mechanisms.  Models suggest storms in northeast OK and south of us between the Red River and Oklahoma City.   Those are our two targetsoi

First Two Targets: May 27, ncentral to ne Oklahoma; May 28, west-central TX

Update on Discussion to Include Preliminary Possible Targets:  May 27 ncentral Oklahoma; May 28 west Texas;  May 29 west Texas (or transition); May 30,  central KS; May 31 Nebraska Panhandle

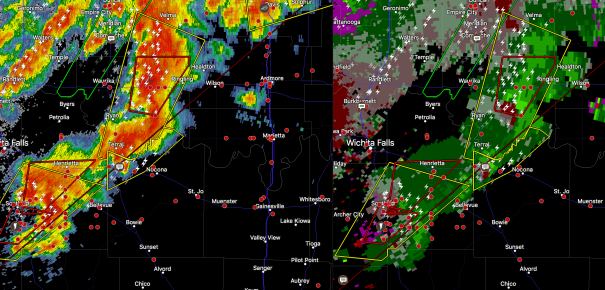
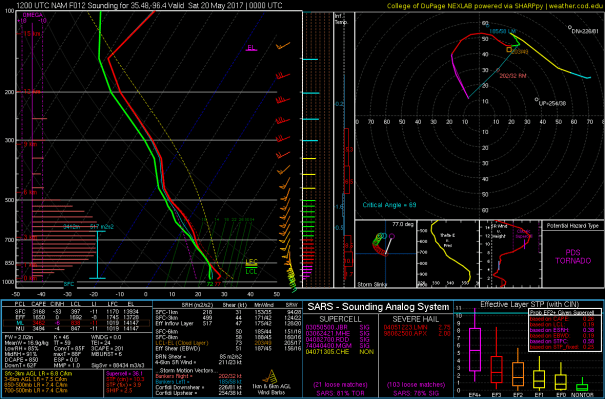
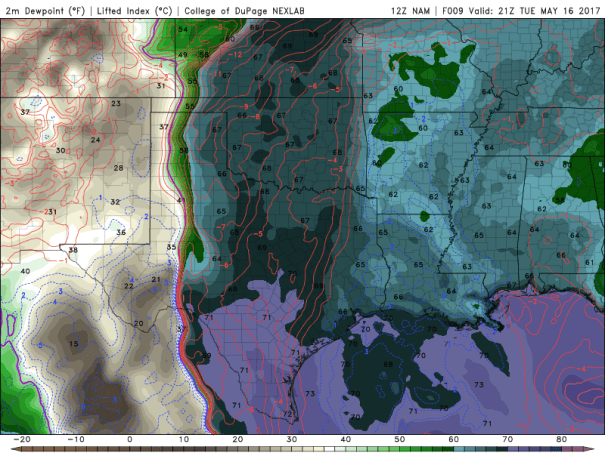
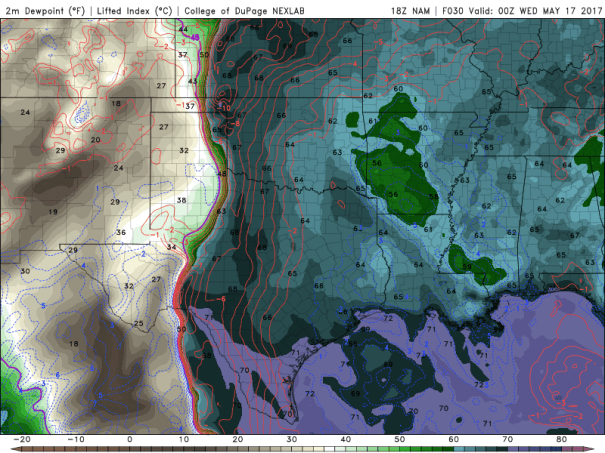
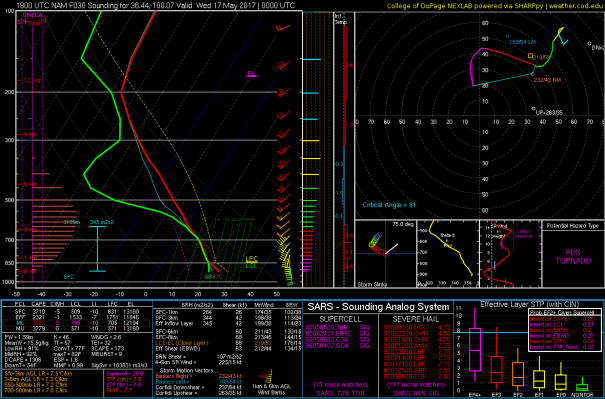
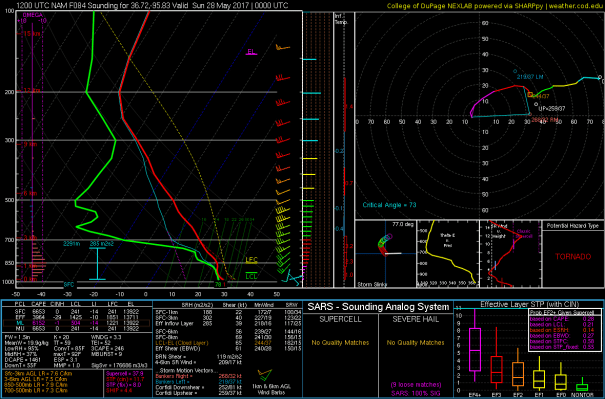
The targets on May 27 and May 28 remain basically the same.   There are small differences between the GFS and NAM for the major threat day, Saturday May 28, with the GFS further southwest with the triple-point.  Still, the thermodynamics are very impressive, with forecast mlCAPE values on the order of 5000 J/kg in areas with somewhat to very favorable shear.  This is a sounding for between Tulsa and Ponca City forecast by the NAM along with the forecast dew point field.   I should point out that another area that is emerging is the area between Wichita Falls and Ardmore from 0000 UTC to shortly there after as the shear profile becomes very favorable.
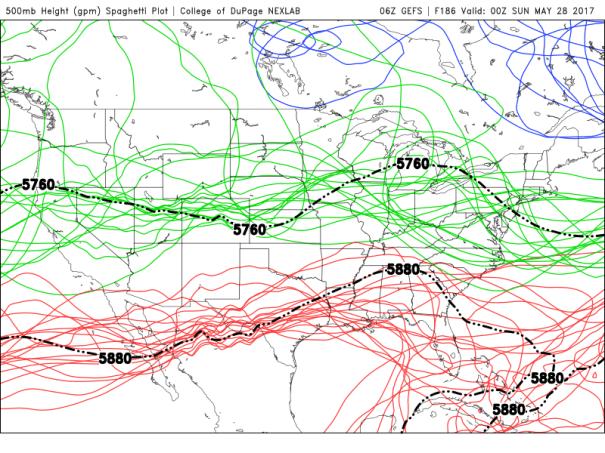
NAMSGP_sfc_dewp_060.png

2017052512_NAM_060_35.97,-95.86_severe_ml.png

May 28

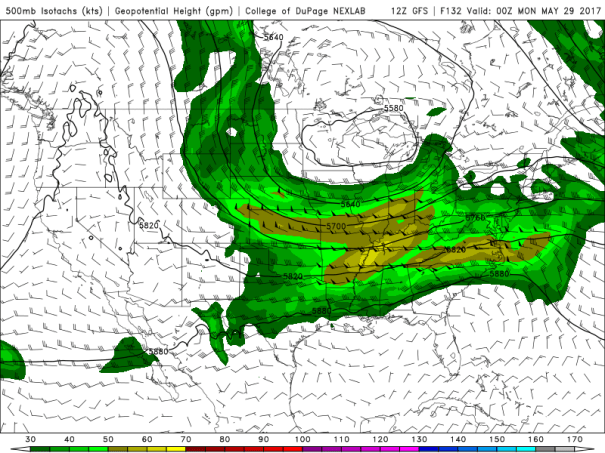
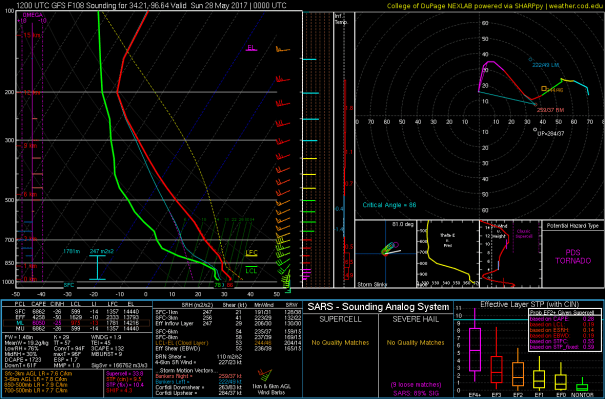
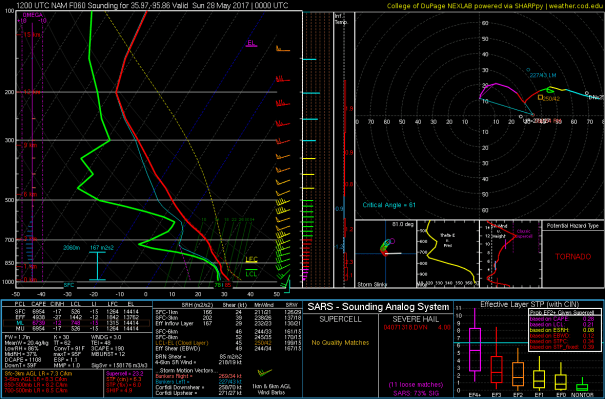
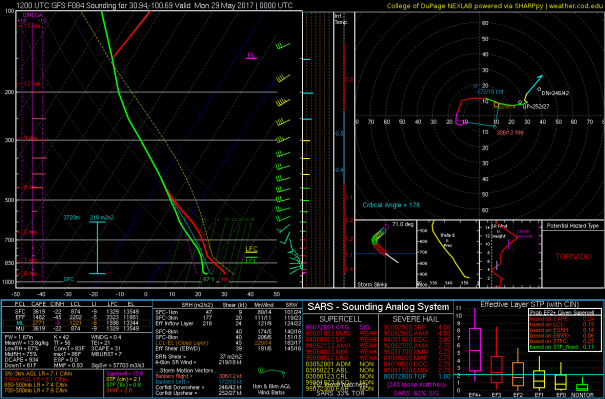
There are greater differences between the NAM and GFS for the risk area for the following day, Sunday May 29.  The NAM has the stationary frontal boundary ending up further south in TX and the GFS just south of I20. Hodographs just north of the boundary are forecast to be favorable in an environment of rich dew points.  Here’s a forecast sounding for someplace between San Angelo and Fort Stockton.

2017052512_GFS_084_30.94,-100.69_severe_ml.png

May 29 through May 31

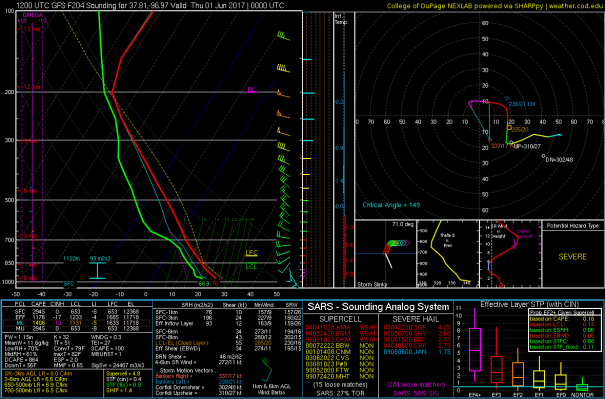
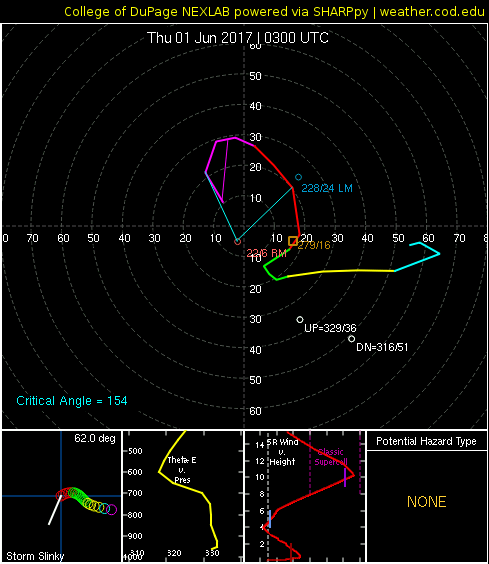
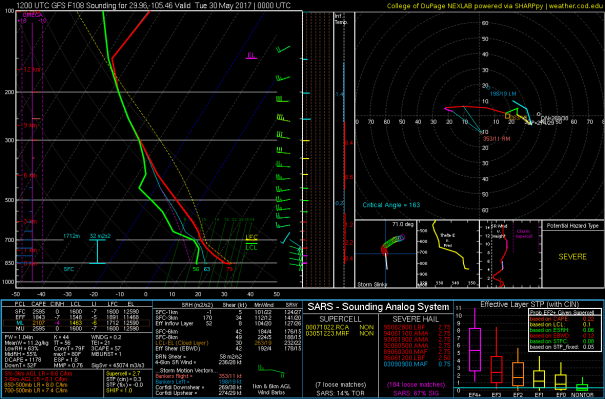
Shear profiles are forecast by the GFS to stay somewhat favorable for rotating storms in the area south of Midland on May 29th.   This will be a day of assessment for us, even if this verifies, because the pattern the next couple of days favors central KS on May 30 and the Nebraska Panhandle on May 31.  For what it is worth, here is the GFS forecast sounding for May 29th someplace west of Ft Stockton.

2017052512_GFS_108_29.96,-105.46_severe_ml.png

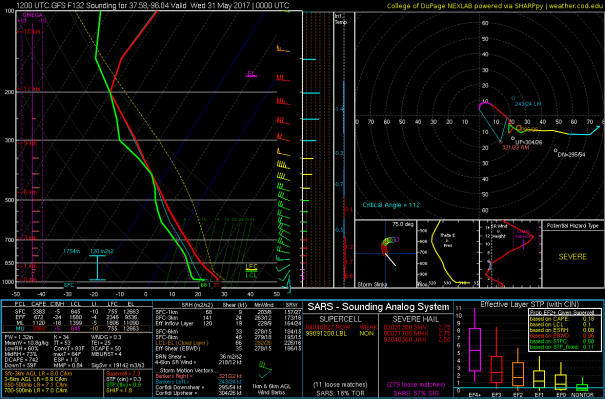
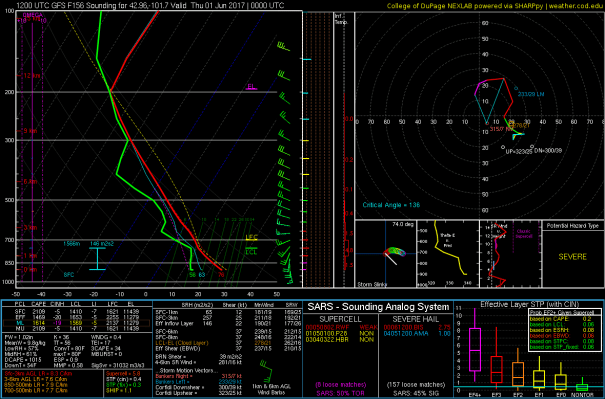
The first sounding below is the GFS forecast for someplace near Wichita KS on May 30th and the second sounding for someplace between North Platte and Scotts Bluff Nebraska on May 31.

2017052512_GFS_132_37.58,-96.04_severe_mu.png

2017052512_GFS_156_42.96,-101.7_severe_ml.png

Discussion

Now that we have settled the date point of entry and  into the Great Plains on Friday evening, I am settling in to look at the meteorology of the target zones for May 27 and May 28.

May 27:  Provisional Target–north central Oklahoma along and east of I35

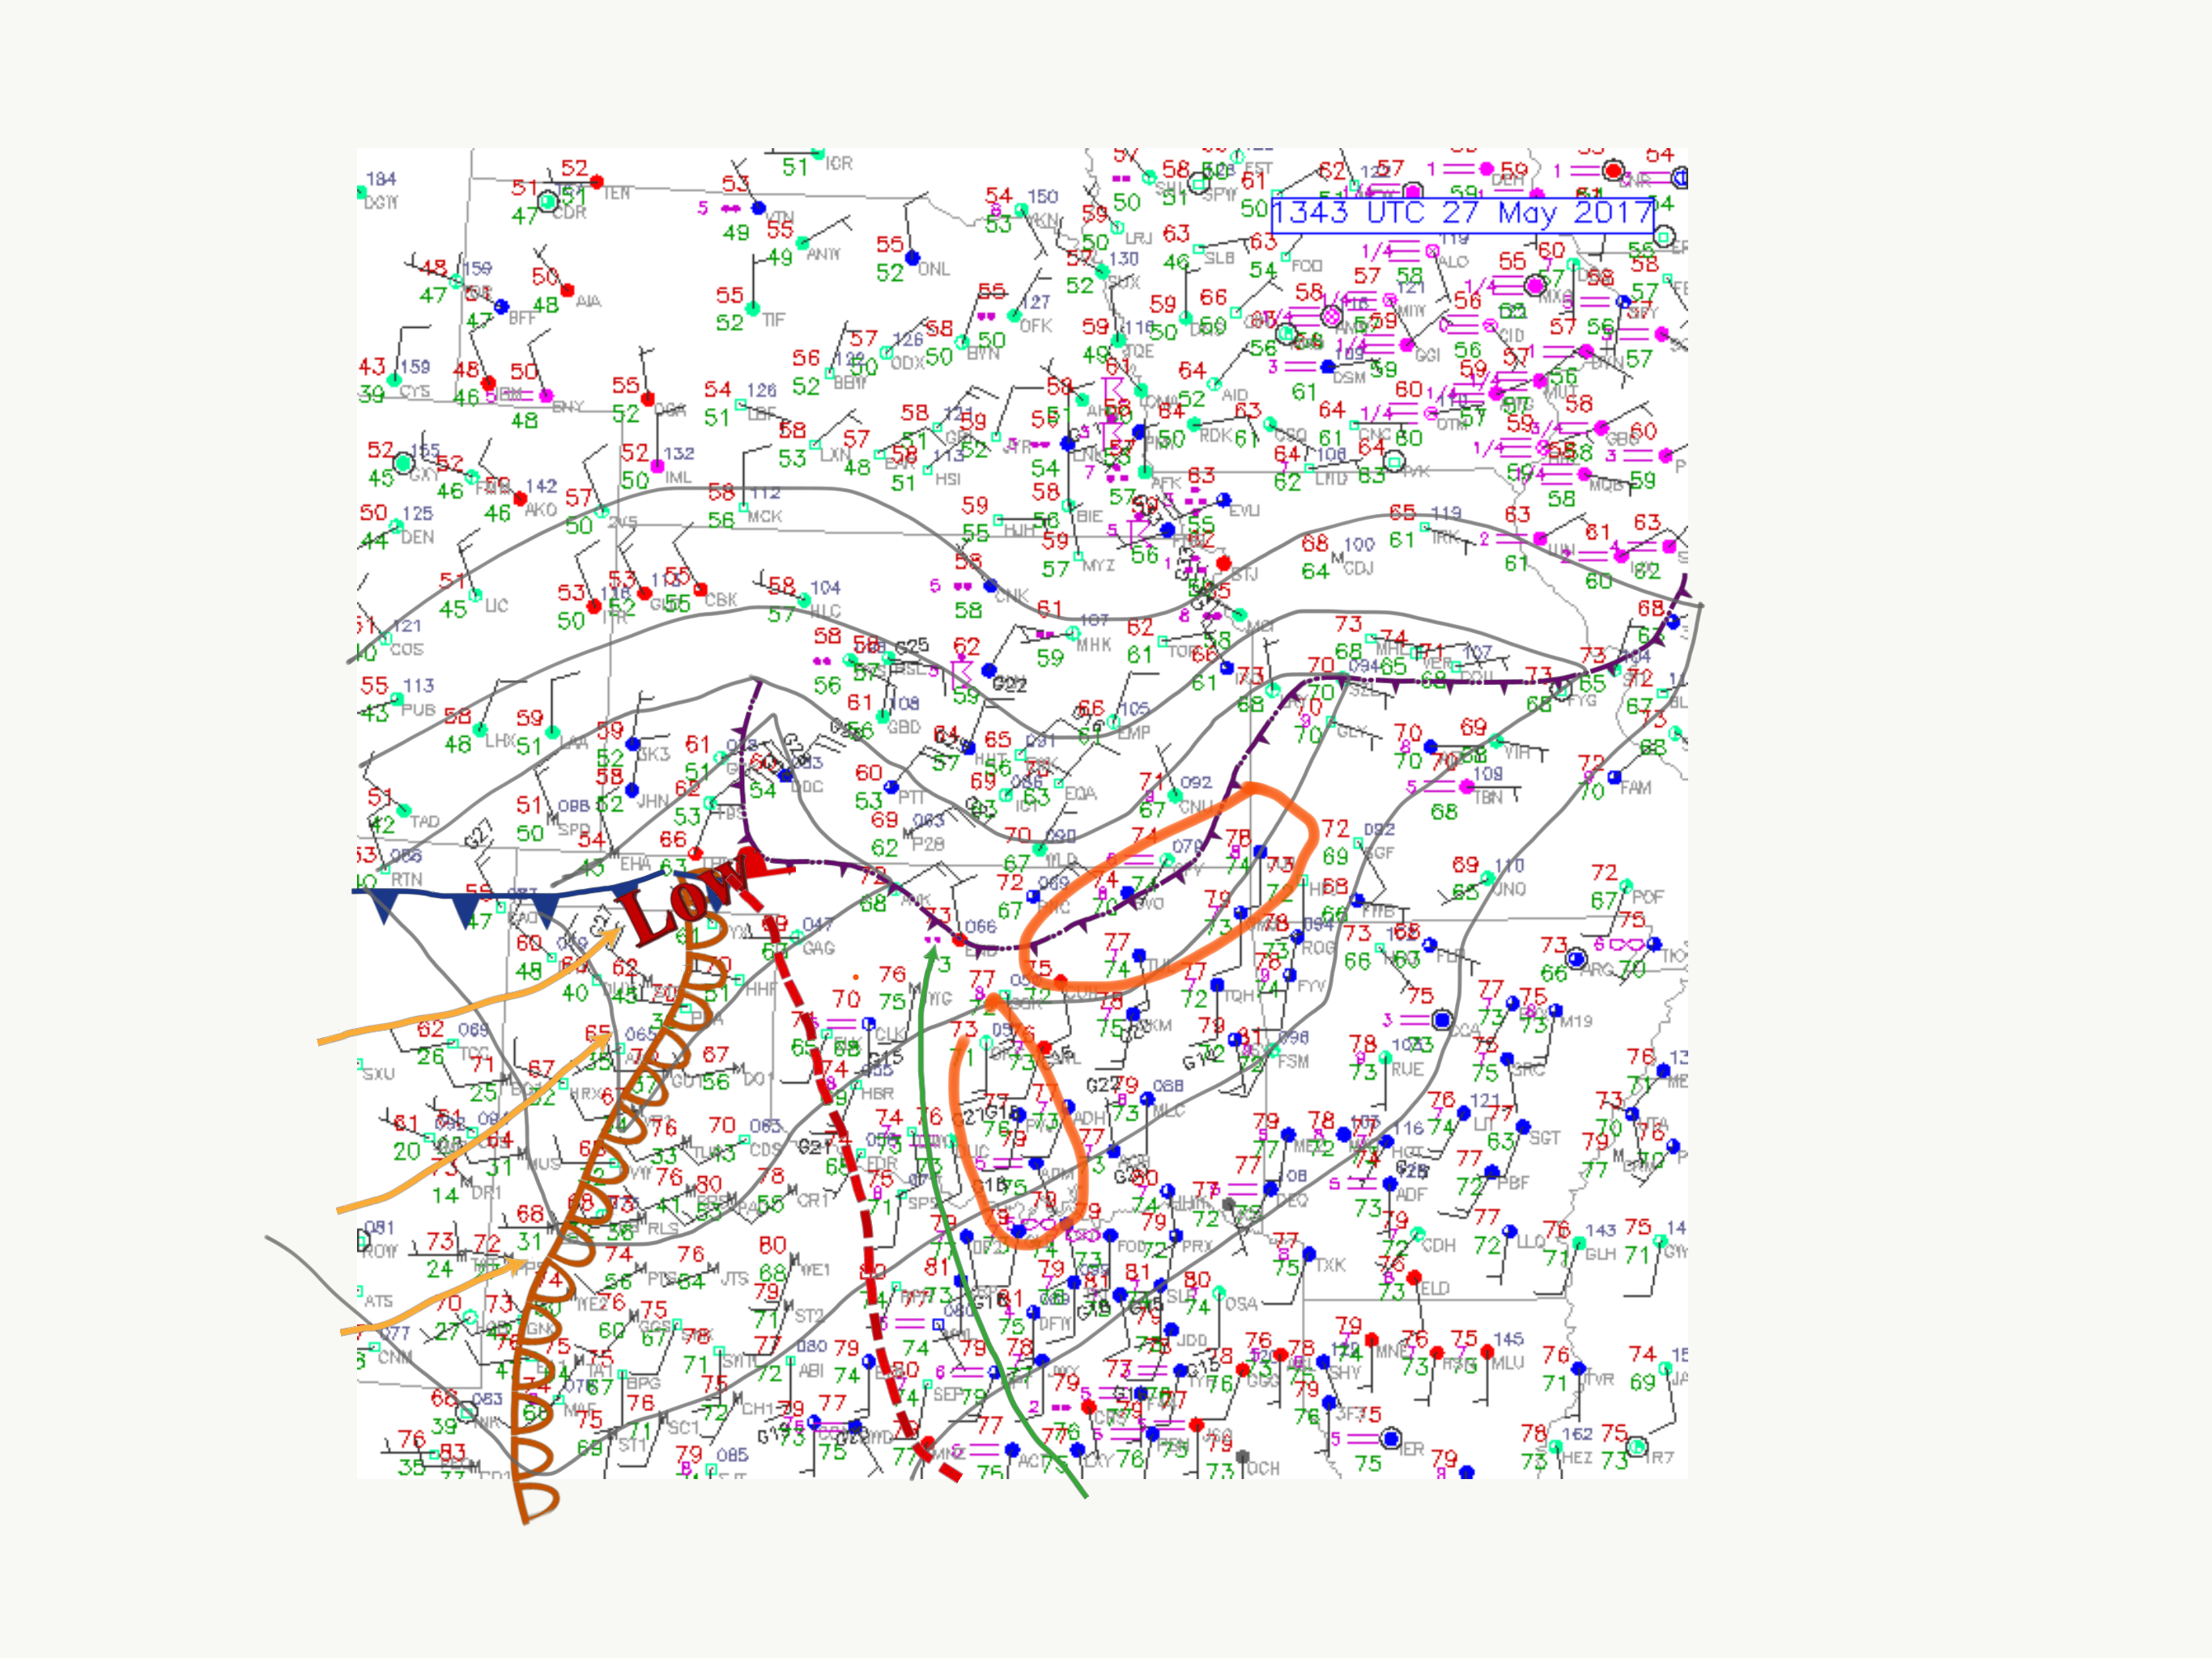
A classic “synoptically-evident” pattern is setting up for Saturday afternoon in Oklahoma.    A dryline surge is forecast by both the NAM and GFS from southwest Oklahoma into the central part of the state.  The GFS has the surge extending further northeast and the NAM has a better backing of the wind at the bulge/triple point (join of warm front, cold front, and dryline).

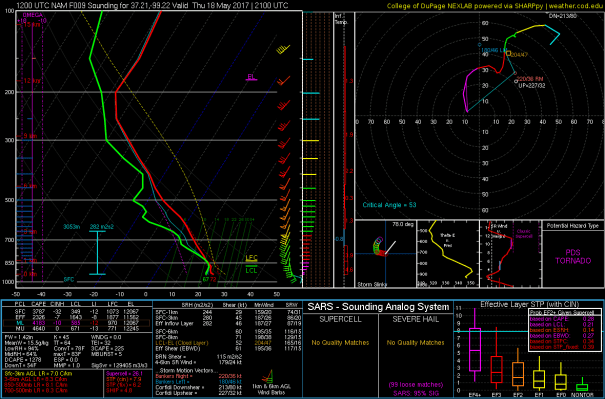
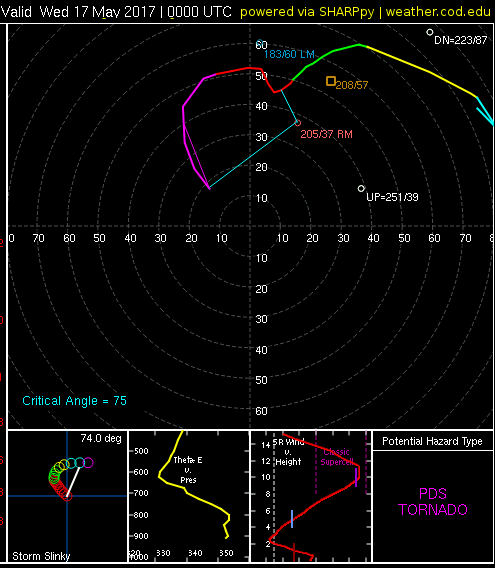
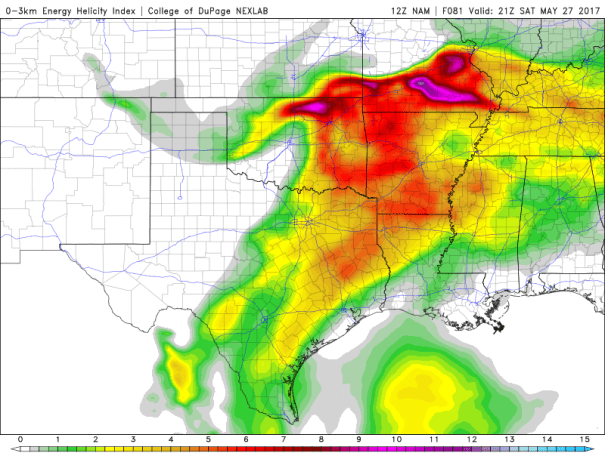
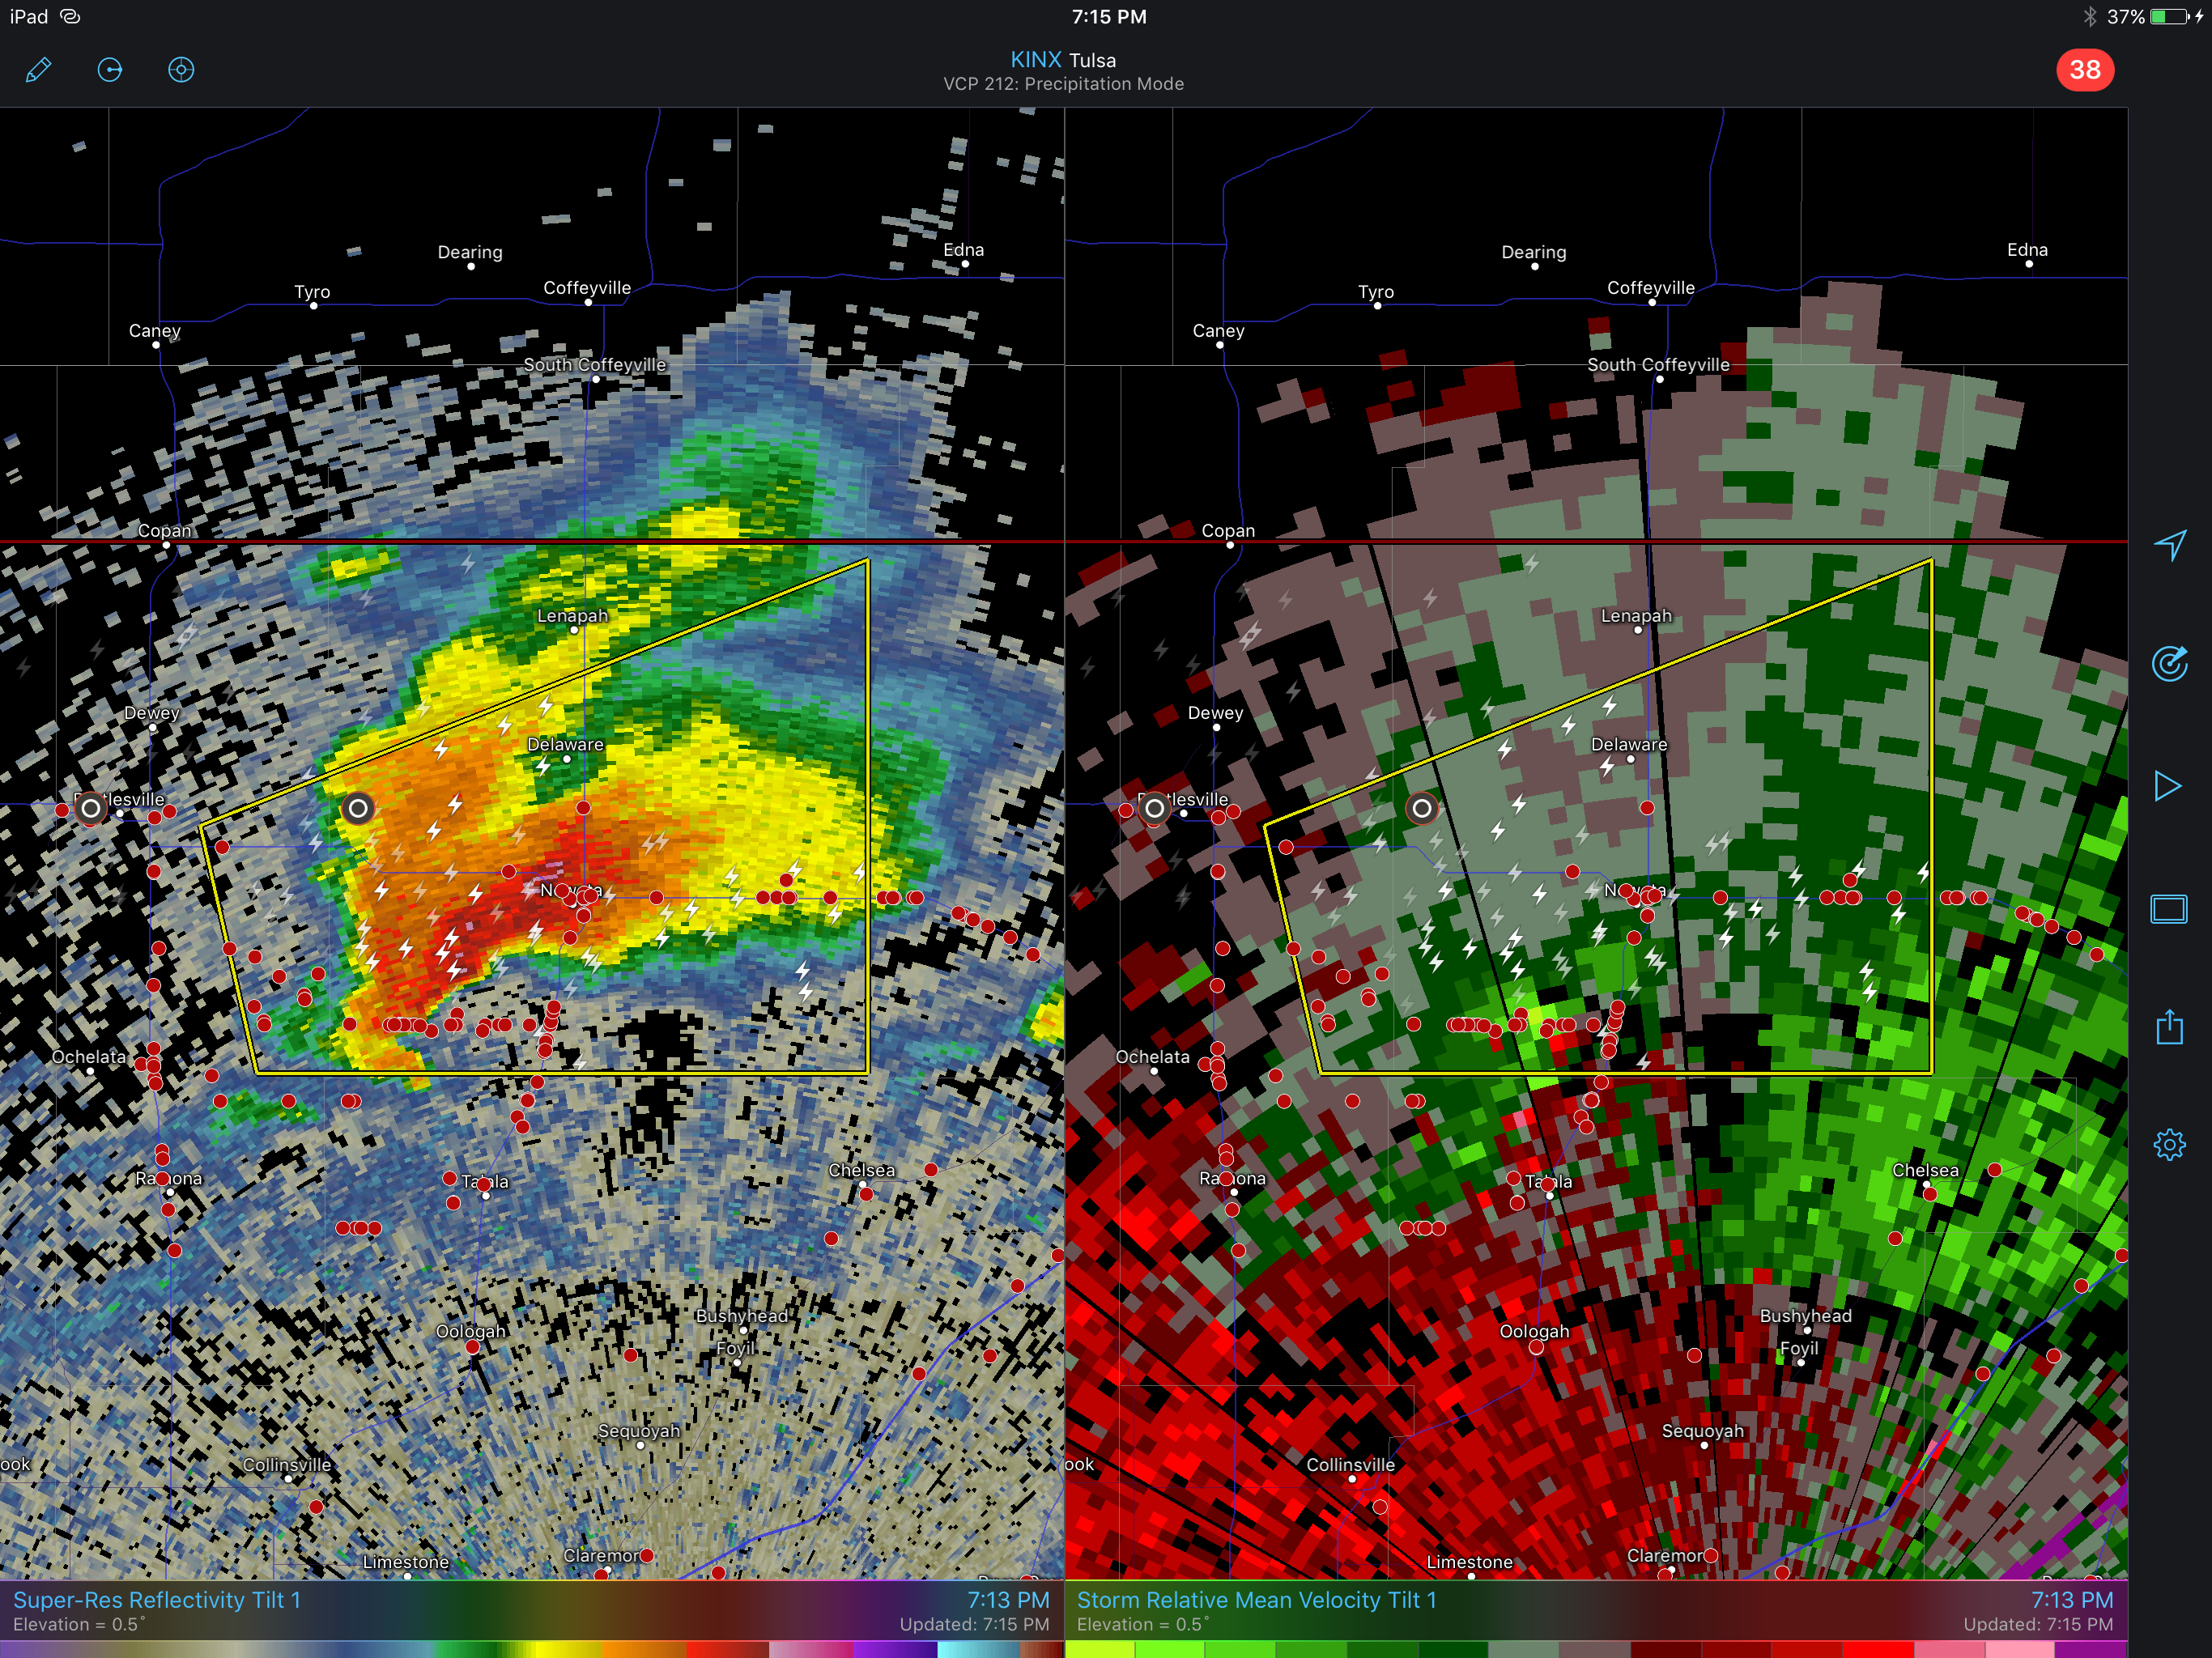
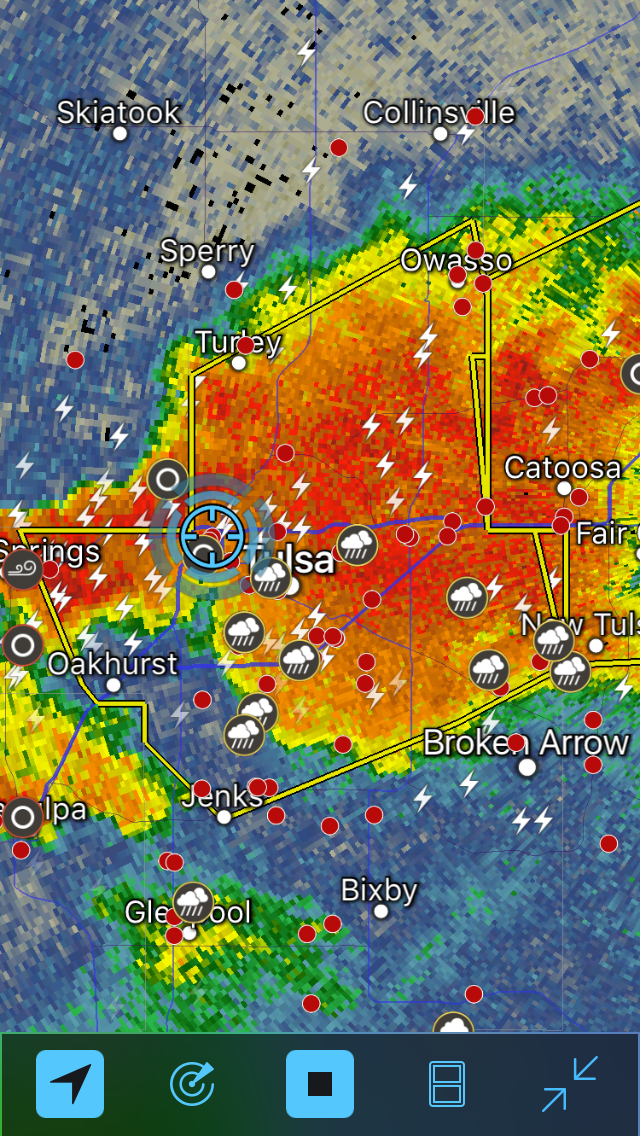
The combination of CAPE, 0-3 km storm relative helicity in an environment of adequate 0-6 km shear is forecast to be maximized by the NAM in the late afternoon in the region from Blackwell through Ponca City.  Storm motions for a right moving supercell are forecast to be towards the east, with 0-1 km shear values in combination with updraft approaching very high values northeast of Tulsa by late afternoon early evening.  The forecast sounding below is for a place somewhere between Ponca City and Tulsa near the triple point.

The “negatives” center on cap strength in the afternoon.   Right now, the NAM has no storms breaking out near the triple point, but some breaking out north of the warm front.  Hence, we will need to keep on storms forming in southern Kansas in the region in which they still will have access to the CAPE rich air south of the boundary, and that could move along the boundary, “ingesting” great helicity.

We are hoping that this sort of target materializes as we move closer to May 27, rather than one that encompasses the OKC metropolitan area.

NAMSGP_con_3kmehi_081.pngNAMSGP_con_stp_084.png2017052412_NAM_084_36.72,-95.83_severe_ml.png

May 28:  west central Texas:  Provisional Target Garden City to Fort Stockton TX

The NAM, GFS, and CFSv2 do not surge the cold air behind the cold front all the way through Texas.  Part of the reason for this is that all three models leave a fairly strong subtropical branch of the westerlies over the middle of Texas, rather than changing the wind aloft to northwest.  This results in a “non-classic” setup for that part of Texas, with a nearly stationary boundary with ene flow on one side and sse flow on the other, with adequate CAPE on both sides.GFSSGP_con_sbcape_108.png

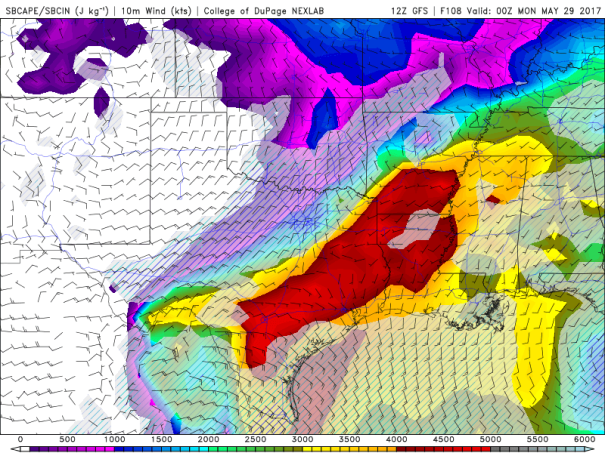
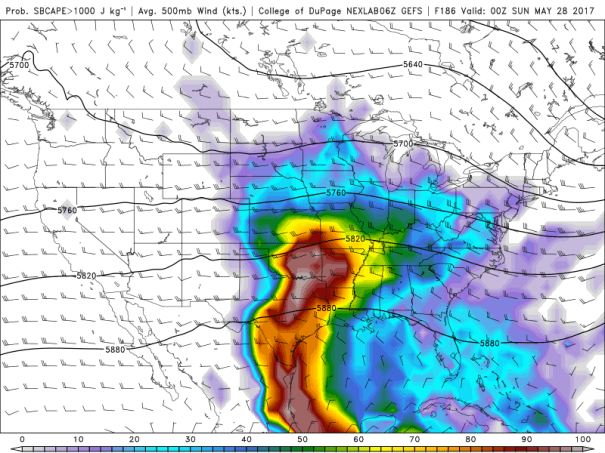
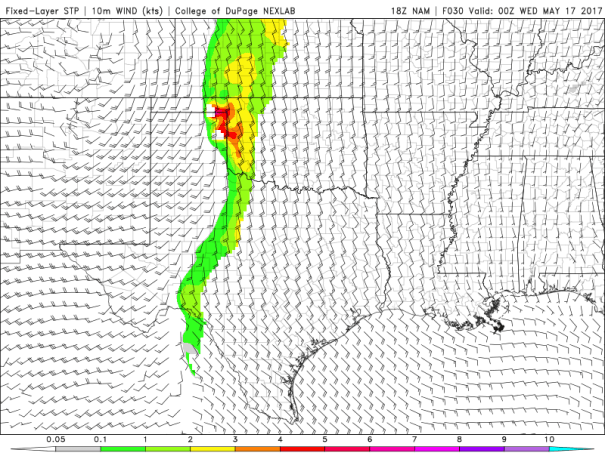
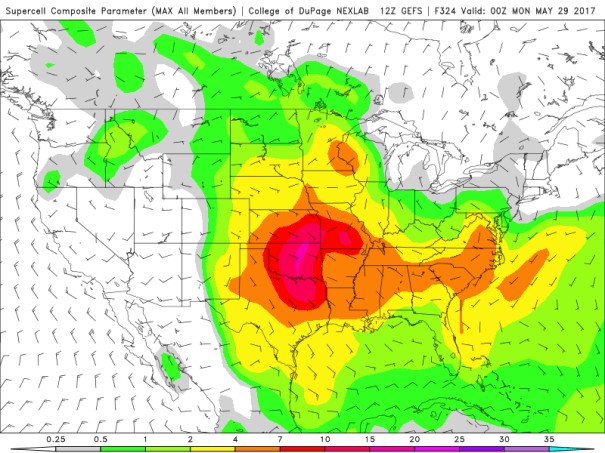
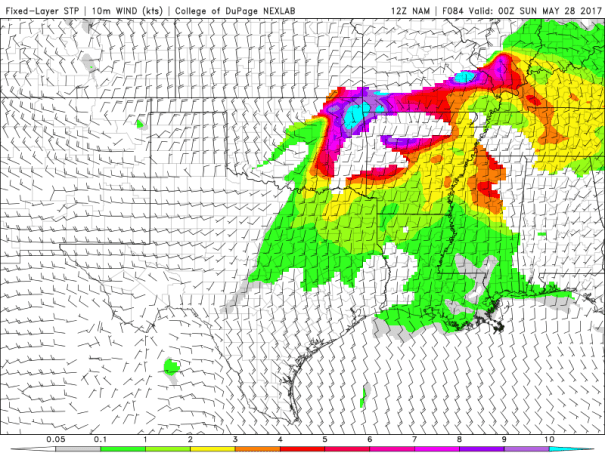
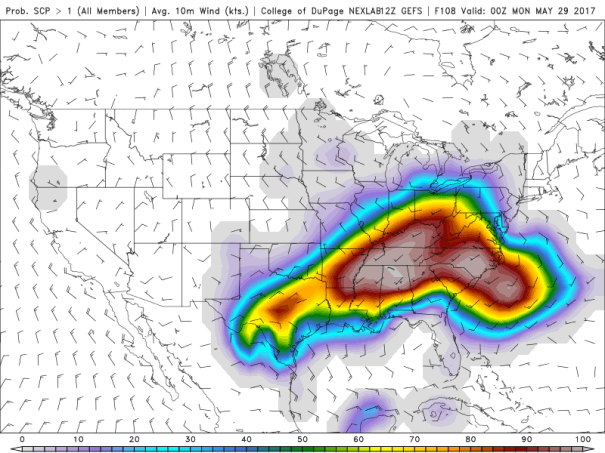
The GEFS (ensembles) agree that the ingredients for supercells will exist in the area if storms can break out Sunday afternoon.  Here’s the ensemble mean probability of Supercell Composite Parameters greater than 1 for Sunday evening.    We are likely to target the area near storm initiation point, which would be north of Fort Stockton in the Garden City TX area, if we can get to it from the previous day’s target.

GEFSUS_con_probscp_108.png

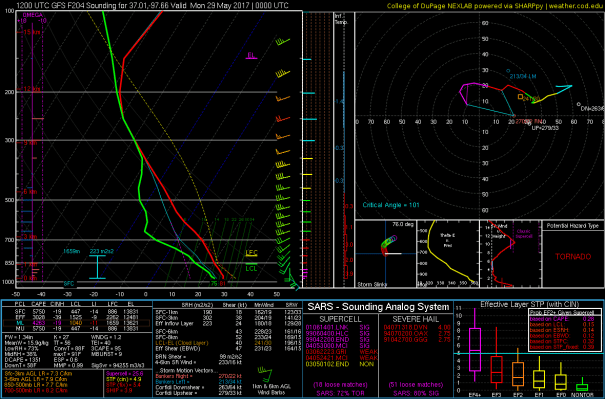
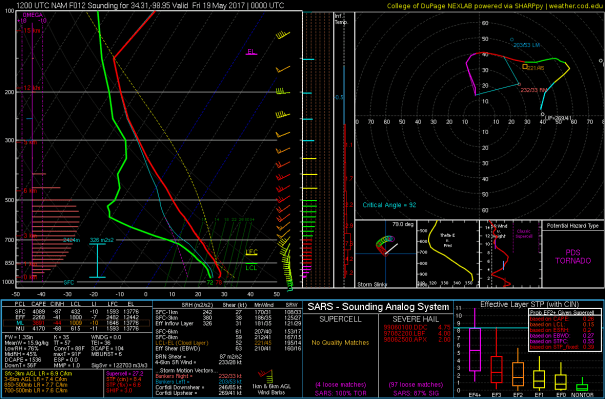
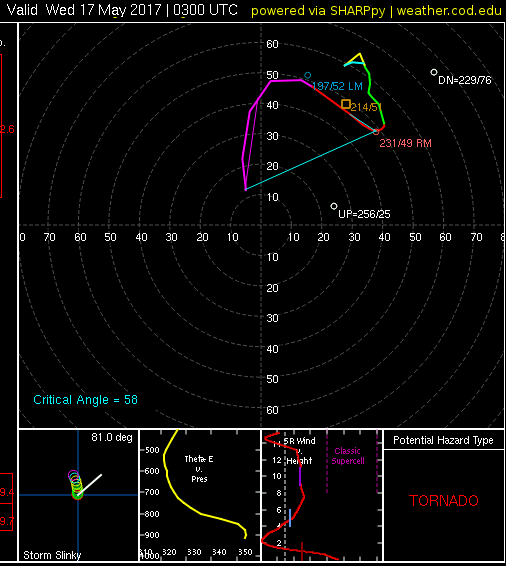
The soundings forecast for that area have more than enough CAPE.  The issue would be the low level and the 0-6 km shear.   This is a forecast sounding for a spot between San Angelo and Garden City TX.

2017052412_GFS_108_29.54,-99.94_severe_ml.png

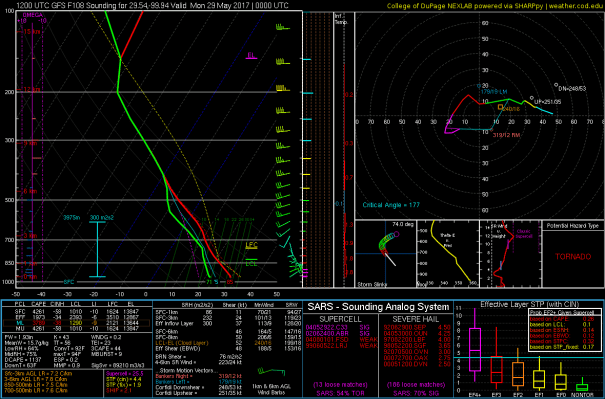
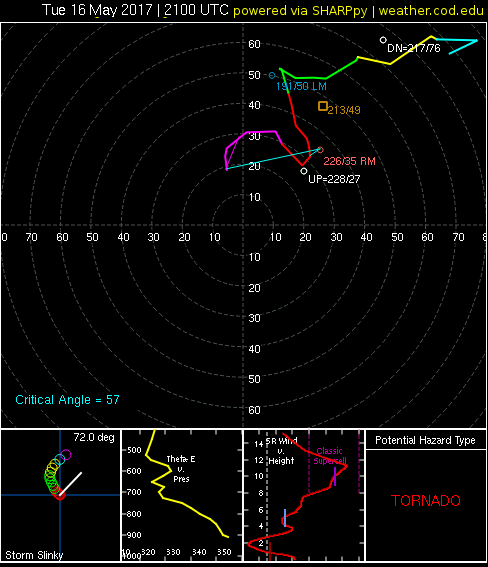
All four of the models have west-southwesterly winds of 40 to 50 knots over the area Sunday evening.  In this particular sounding, there is 46 knots of 0-6 km bulk shear and lots of positive shear.

And so our provisional target if this verifies would be somewhere around Rankin or Garden City TX.

May 23, 2017: Shift in Outbound Destination to Oklahoma City

Discussion

The week of our trip is now in range of the outer edge of the synoptic-scale model (NAM) and in the “believable” range of the medium range models, like the GFS.  The GFS and NAM both develop southwesterly flow at 500 mb by Friday 26 May, with surface moisture “return” from the Gulf of Mexico beginning in the south on Thursday 25 May, and then entering Oklahoma on the 26th.

The evolution of the pattern after that depends upon how the models handle the amplitude of the major trough in the West.   If the amplitude grows at the expense of progression, then southwesterly flow will linger over the area, with the NAM beginning to suggest that.

Both models leave a branch of the westerlies over Texas for the Sunday-Tuesday period.  Bulk shear in the 0-6 km layer of 35 knots phased with buoyancy shifts from Oklahoma on Saturday to central Texas on Sunday.  The GFS has a couple of short wave troughs embedded in the southern branch that probably will be players, if they verify.
GFSUS_500_spd_132.png

Then, as the ridge in the middle and upper troposphere shifts eastward further north, two areas of favorable deep layer shear emerge, one in upslope in west Texas and New Mexico’s eastern Plains and another over north-central Oklahoma and Kansas with northwesterly flow aloft.

The net effect of all of this is that initially the pattern on Saturday focuses on central Oklahoma, with some impressive looking soundings and hodographs around Tulsa south to Ardmore.  Some of the hodographs have a midlevel weakness, though that kind of detail is not trustable this far out.
2017052312_GFS_108_34.21,-96.64_severe_ml.png

This is the forecast sounding and hodograph for somewhere along the I35 corridor south of Oklahoma City on Saturday afternoon 27 May.

2017052312_GFS_204_37.81,-96.97_severe_ml.png

And this is the forecast sounding and hodograph for someplace near Wichita KS on Wednesday evening 30 May.  What struck me about that pattern is how the wind profile evolves in the next hours, to one that looks extremely tornadic.  Of course, by this time surface temperatures will have cooled, but if a thunderstorm is existent and moves into that shear environment, there will be some interesting rotational developments near the surface, so to speak

.2017052312_GFS_207_38.17,-97.84_severe_ml.png

So, we have changed our outbound reservations to arrival at Oklahoma City Friday evening around 10PM.

Looking Ahead to a Week of Chasing: May 26th and On…

Discussion

The period of interest that has been highlighted by the CFSv2 in a number of ways, including the so-called “chiclets” chart is now within range of the medium range models. Within 10 days the accuracy correlations of the prediction of the GFS with verification at least exceeds 0.6 and of the GEFS ensemble mean 0.7.

cfs_bchiclet.png

The lack of general severe weather ingredients over the next few days is highlighted by the blue colors here.  But that does not mean that conditions would not be favorable in geographically small areas.  In this case, it does appear that severe weather is likely in the extreme southern Great Plains over the next few days.  The “X” appearing in the box indicates a Supercell Composite Parameter at least one point exceeding 10.

But it’s clear that the larger, broader pattern favoring risk over a good portion of the Great Plains develops later in the week.  For example, take  the GEFS spaghetti plot for Saturday May 27 (CDT)…that now shows the development of the subtropical branch mentioned in previous posts below.  There is good coherence between the solutions.=
GEFSUS_500_hghtens_186.png

This ushers in (at least in these forecasts) an extended episode of southwesterly winds at 500 mb over the Great Plains.  The ensemble mean averages out to around 30 knots, which suggests a deep layer shear (when combined with southeasterly surface flow) favorable for supercells.  For example, here is a GEFS plot of the maximum Supercell Composite Parameter for Sunday May 28th.

GEFSUS_con_maxscp_186.png

This is consistent with the ensemble mean’s forecast for surface based CAPE >1000 J/kg and 500 mb winds, which is shown below.

GEFSUS_con_cape1000_186.png

Finally, the operational GFS, which is really one of the 21 solutions averaged out in the two plots above, has some interesting patterns.  Here’s the sounding and hodograph for the area along the Oklahoma/KS border south of Pratt, KS, for Sunday 28 May (CDT).

2017052012_GFS_204_37.01,-97.66_severe_ml.png

So our plane reservations for May 26 afternoon are holding firm….

May 19, 2017: Virtual Chasing Today–Boundaries, boundaries, boundaries..

Storm Reports

yesterday.gif.png

Here are the severe storm reports for this day.  There were two tornadoes and a bunch of other reports in our target box.   We would have been in the Ardmore area, but whether we would have seen the tornado that was seen there is another question.  That storm was an HP-supercell, so being in the right place without putting oneself in danger is difficult.  We definitely would have missed the cluster of tornadoes in south-central KS, which really stands out on this map.

Tornado Warnings

Screen Shot 2017-05-19 at 4.22.56 PM.png

These storms appear to have an inflow coming from the warm air side of the outflow boundary.


Still Virtually Waiting

May19._20UTC.jpg

Very moisture rich air converging along outflow boundary complex from nw TX to south-central OK.  Still hoping for surface-based convection initiation or motion in that oval.  Right now, all cells are moving due north into CIN away from the best water vapor and shear.

Discussion

Ingredients setting up with a Red River focus in south-central OK and north-central TX today I think.   There are many boundaries to consider.  Right now two of them seem to be coming to a halt from sw to ne across that area.  The sounding and hodograph  is forecast for this evening just northeast of Ardmore OK.

5_19_17.jpg2017051912_NAM_012_35.48,-96.4_severe_ml.png

May 18, 2017: South-Central KS and NW Oklahoma Primed

Metropolitan State Crew Witnesses Several Tornadoes Near Waynoka, OK

This cell phone capture is by Scott Landolt.  Other photography by Sam Ng and Cameron Redwine coming.

IMG_9027.JPG.jpeg

First Storm Rapidly Becomes a Tornado Producer

Screen Shot 2017-05-18 at 12.04.35 PM.png

SWOK.gif

Convective initiation has happened in the area along either side of the Red River west of Wichita Falls.  The first storm rapidly became a supercell, with a confirmed tornado.

Discussion

Ingredients are going to be phased this afternoon for an outbreak of high-end severe weather in the southern Great Plains.  The morning surface map is reminiscent to me of several in which the triple-point area has high enough dew points on both sides of the synoptic-scale boundary to mitigate any problems with CIN.  In fact, there may be too little CIN, and too many storms with outflows interfering with one another.

1500UTC.jpg

However, the convection-allowing-models are suggesting the an early round of storms will not disrupt the low level moisture and shear fields, although there will be boundaries around to complicate things. So my attention is drawn to the eventual location of the triple-point this morning, which will slowly end up 100 miles or so further northeast.

There, in the strongly backed surface flow, the hodograph loops are forecast to be enormous, eventually.   But with some suggestions that the first storms will be in a shear environment that will have them entraining precipitation into their updraft areas initially (see 2100 UTC sounding/hodograph for a point between Woodward and P28) in a setting with enormous CAPE.  But by 0000 UTC that hodograph weakness does not appear to be an issue (see 0000 UTC sounding/hodograph not at the same location but a bit further southeast).

2017051812_NAM_009_37.21,-99.22_severe_ml.png

2017051812_NAM_012_36.41,-98.08_severe_ml.png

My initial target would be sort of in the middle of that box, about halfway between Woodward and Medicine Lodge.  It will be difficult not to give into the impulse of chasing the first storms that popup, because they will be supercells.  They will also be fast moving, taking observers further away from the eventual target (I think).

I should point out that some interesting set of ingredients also along Red River area around 0000 UTC but with, it looks like in the forecast soundings, too much CIN. But if a storm develops there…boom, with lots of low level shear too.  This forecast sounding is for a spot between Wichita Falls and Altus at 7PM CDT.

2017051812_NAM_012_34.31,-98.95_severe_ml.png

Violent Tornadoes Possible Today (Tuesday May 16, 2017) in eastern TX Panhandle/OK Panhandle/w Oklahoma

GOES-16 Visible Imagery Loop

20170516000000_storms.gif

Spectacular high resolution visible imagery from GOES-16 showing McClean TX and Elk City OK tornadic storms.   Note the horizontal convective rolls clearly exhibiting helicity being intercepted and deformed into the Elk City supercell’s (southern storm) updraft area.

Elk City Oklahoma Damaged by Tornado

This animation shows the supercell associated with the tornado that caused damage in Elk City, OK, at around 7PM CDT, 16 May 2017.

Latest radar image from KAMA, at around 4:30PM CDT.

Screen Shot 2017-05-16 at 2.27.31 PM.png

Discussion

The morning surface map shows a rather uniform setup east of the dryline in the western portion of the southern Great Plains.  Rich moisture is being advected rapidly into the area from south-central KS south to north Texas into a deep wave cyclone.

A focus has been forecast to develop in the eastern TX Panhandle into w Oklahoma today in association with the development of mesoscale low pressure in northeastern New Mexico and the northern TX Panhandle.  This is already affecting the wind field in ne New Mexico.

5_16_17.jpg

Southwesterly winds of 40 to 50 knots already overlies this area at 500 mb.  This is expected to continue during the day as the dry line processes eastward, and convergence between it and the moisture tongue focuses in the area highlighted.  Earlier runs had a dryline bulge into that area as well, though the latest NAM forecast for 21 UTC  does not.

NAMSGP_sfc_dewp_009.png

It does not appear that initiation will be a factor because the cap is expected to erode ahead of the dryline position and about 50 km east.

The convection-allowing-models show isolated storms developing between 21 UTC and 0000 UTC.   In the case of the NAM, one of these storms develops near Amarillo and moves northeastward.  While it is doing that the wind shear environment evolves in the forecast to one suggesting both violent mesocyclones, and given the strong low level shear, potential for long-track violent tornadoes along the track of this particular storm.

I have not included the soundings below, because several of the points I plotted were in the updrafts of that storm.  However, you can see the hodograph evolution northwest of Gage OK for these three model hodographs, 21 UTC, 00 UTC, and 03 UTC.    If the middle hodograph develops in this manner, there will be a three hour period or so when a storm in that environment will be taking advantage of that enormous shear and long hodograph loop implications.

The final hodograph, though, indicates that the storm motion will be near the hodograph, so evolution into an HP-supercell would be likely.   Along the way, any large tornado would likely be wrapped in rain the last few hours of this cycle.  Earlier on, this looks like a classic supercell tornado setup, though.

2017051612_NAM_009_35.58,-100.36_severe_ml.png2017051612_NAM_012_35.84,-100.15_severe_ml.png2017051612_NAM_015_36.31,-99.85_severe_ml.png

Violent Weather Outbreak Seems Likely Tuesday 16 May 2017

It’s hard to ignore the strong signals arguing for some high end severe storms tomorrow in the southern Great Plains.   The only issue appears to be whether initiation will occur.

The latest run of the NAM has a marked dryline bulge into northwestern Oklahoma Tuesday afternoon, with strong low-level convergence along it.

NAMSGP_sfc_temp_030.png

You can see the convergence showing up in the wind field from just north of Abilene to the eastern TX Panhandle Tuesday evening around 7PM in the forecast view.  It also shows up in a dryline bulge and marked dew point gradient in the same area.
NAMSGP_sfc_dewp_030.png

Overspreading that area Tuesday afternoon will be southwesterly winds >50 knots providing strong 0-6 km shear.  This in combination with the other ingredients, including mlCAPE values >4000 J/kg has the Significant Tornado ParmeterNAMSGP_500_spd_030.pngNAMSGP_con_3kmehi_030.pngNAMSGP_con_stp_030.png

One weakness is in the lower mid-troposphere winds, that results in the right moving storm being awful close to the hodograph at around 700 mb. Such a storm might produce a tornado early, and then become outflow dominant.  The sounding and hodograph are for a location north of Altus Oklahoma.
2017051518_NAM_030_36.44,-100.07_severe_ml.png

Should be an interesting and potentially dangerous day for storm observers in western Oklahoma.

Playing the Long Range Forecast Game

The decision on dates for a storm observing/chase trip is not an easy one, when one does not live in the Great Plains.   We must constantly juggle possible plane reservations against whether nor not the patterns will be favorable.

As of 15 May 2017,  medium range models  (the ones that go out 384 hours) are fairly consistent in shutting out the 20 – 23 May period. Beyond May 23rd, the Global Ensemble Forecast System (GEFS), which makes 21 tries at forecasting a pattern by slightly varying the initial conditions,  still has five or six solutions that are favorable for the southern Plains.  It even has the solutions further north have an undercutting subtropical branch of the polar westerlies coming across that area gradually through early to mid next week.

By the Memorial Day weekend the solutions either have a strong disturbance with favorable central and southern Plains parameters coming in Thursday or Friday, or not. But what the GEFS and another one of the models, this one going out much further into the future,  the Coupled Forecast System (CFSv2 )”think” will happen is there for, at least in the subtropical branch, there to be adequate deep layer shear and CAPE.

Here’s the forecast way out into the future for Sunday 28 May CDT showing the region in which the GEFS “thinks” juxtaposition of favorable fields of deep layer shear, low level shear favorable for rotating updrafts, and buoyancy will occur.  Vapes of 2 or so or more indicate very favorable parameters for supercells in that region.  Whether storms will initiate is a separate issue.

GEFSUS_con_maxscp_324.png

Fig. 1:  Supercell Composite Parameter (SCP), ensemble mean, GEFS, 7PM CDT, 28 May 2017.

Another way of looking at this through 384 h (16 days) and beyond comes from the CFSv2.  Each forecast day has a color that represents the number of points (out of 845 across the United States) that the SCP is favorable, from deep blue (little to none)  to red in numbers of favorable points.     White outlined boxes have favorable conditions at more than 100 of the points, and X’s inside the box indicates that SCP values have exceeded extreme magnitudes at at least one of the points.

Here are chiclets from the 0000 UTC CFSv2 run of 0000 UTC 15 May.  The graph lines show the total number of points at which the average value of SCP is forecast, and the colored lines the number of points exceeding low and extreme values, etc.   The black line suggests an active period starting around the 24th or so.

cfs_bchiclet-1.png

Fig. 2:  CFSv2 chiclets, as explain above from May a5 through June 15.

There has been enough consistency for us to change our flights to inbound to Denver on 26 May and outbound, variable, but nominally 1 or 2 June.